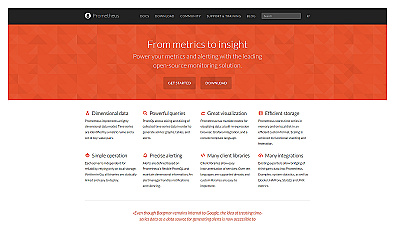
Prometheus
Open-source monitoring solution for system performance and health.
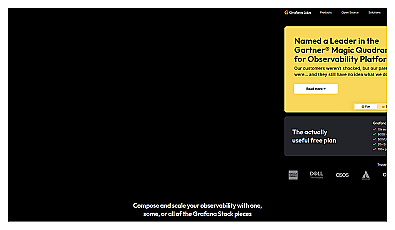
Visual analytics and monitoring for diverse data sources.
Grafana is a robust data visualization and analysis instrument that enables users to create dynamic…
Read more
Open-source monitoring solution for system performance and health.
Real-time monitoring for IT infrastructure and applications.
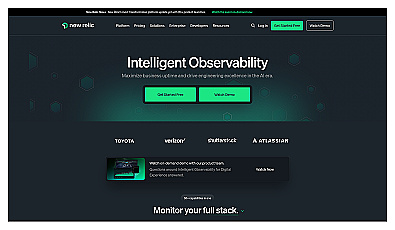
Unified observability for monitoring logs and application performance.
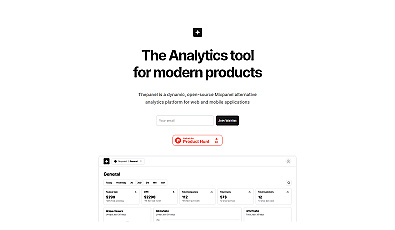
Comprehensive analytics for web and mobile applications.
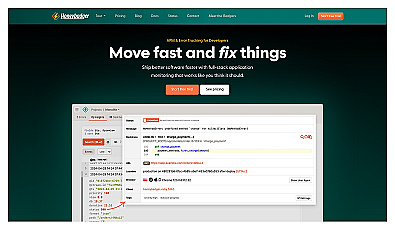
Real-time error tracking and application performance monitoring.
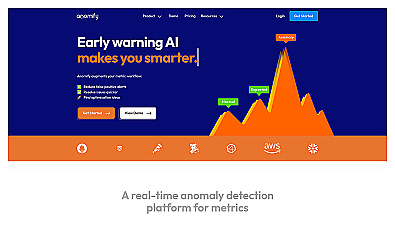
Real-time anomaly detection for operational reliability and performance.
Comprehensive monitoring and analytics for software performance.
Real-time incident resolution for IT operations and development teams.
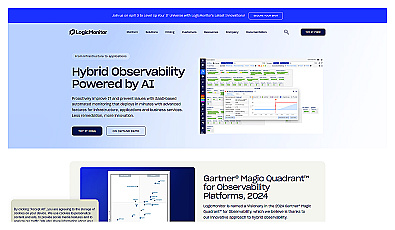
Centralized monitoring for data, applications, and performance insights.
Application performance monitoring and error tracking solution.
Transform audio, video, or text into various content types quickly.
Real-time application performance monitoring and crash alerting.
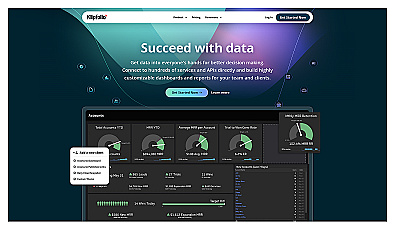
Visualize and report on key business metrics in real-time.
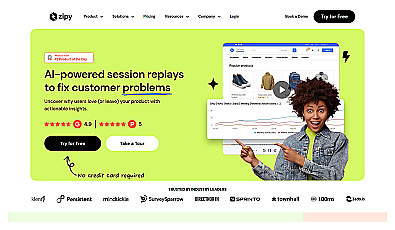
User session insights for optimizing web and app performance.
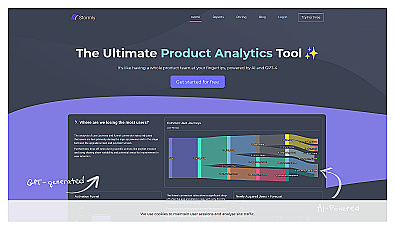
Analyze user behavior and gain insights for product development.
Revolutionizes IT operations with real-time AI analysis and collaboration.
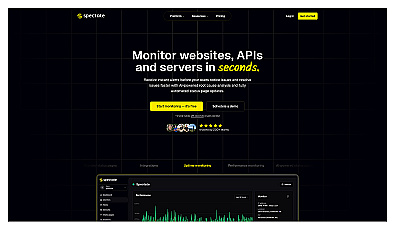
Website and server monitoring with real-time alerts.
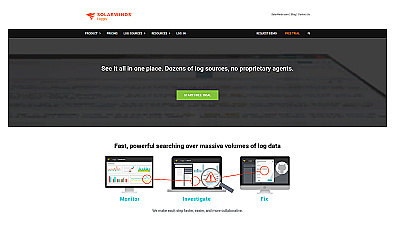
Real-time logging and monitoring for seamless system performance.
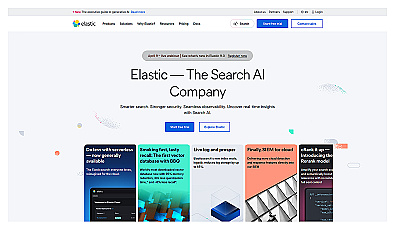
Advanced search and analytics capabilities for data-driven insights.
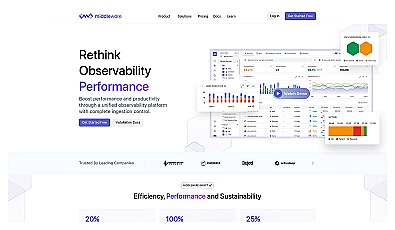
Unified observability data for application performance analysis.
Analyze user interactions with AI chatbots for improved performance.
High-performance database for real-time data insights.
Generative AI-driven operations management for real-time insights.
Real-time monitoring and management for AI application performance.