Data Visualization For Reports Tools

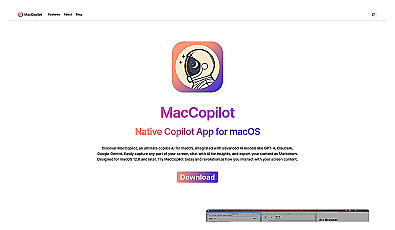
AI-powered screen interaction for enhanced productivity on macOS.
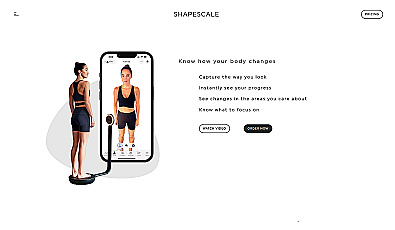
Visualize your body changes with detailed 3D body scans.

Automated imaging for actionable insights across industries.
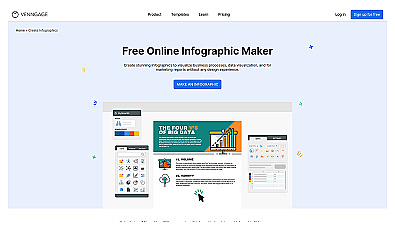
Create visually appealing infographics quickly and easily.
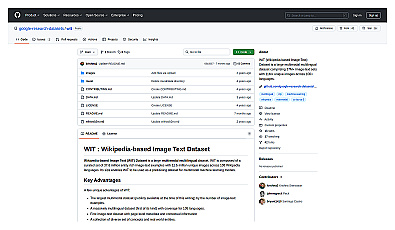
A large dataset of image and text pairs for AI training.
Powerful library for computer vision tasks and image processing.
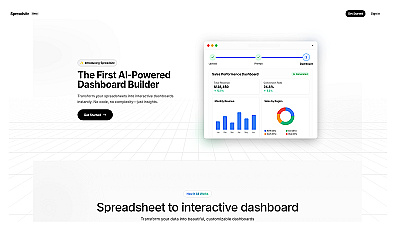
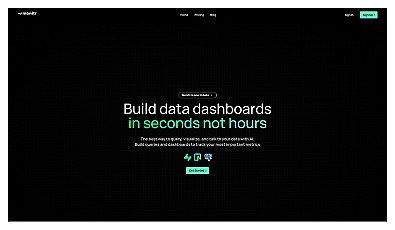
Transform spreadsheets into interactive dashboards effortlessly.
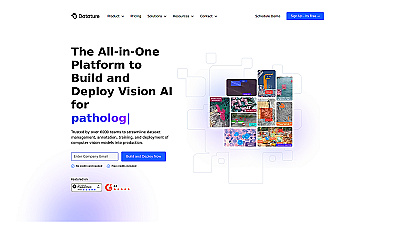
Streamlined management for AI vision projects without coding.
Visualize and organize thoughts with clarity and creativity.

Effortlessly convert PDF tables to CSV format.
Generate insightful reports and visuals in moments with AI support.
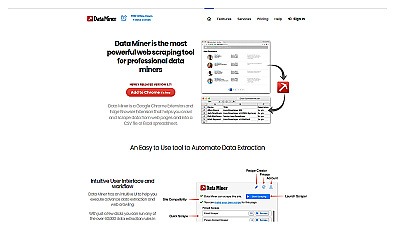
Extract and organize data from websites without coding knowledge.
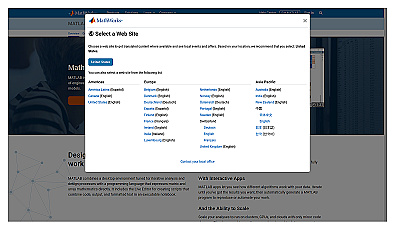
Programming environment for numerical computing and data analysis.

Chat with databases using natural language for quick answers.
Visualizes and curates data for collaborative analysis and insights.
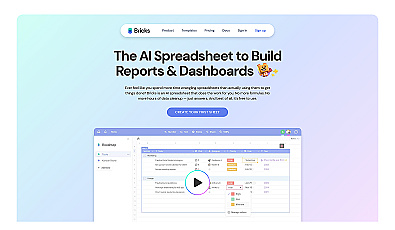
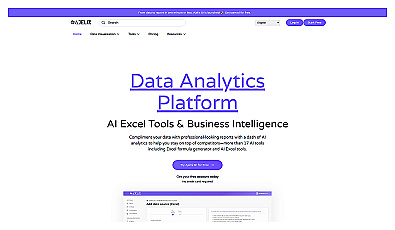
AI-powered spreadsheet for quick reports and data visuals.
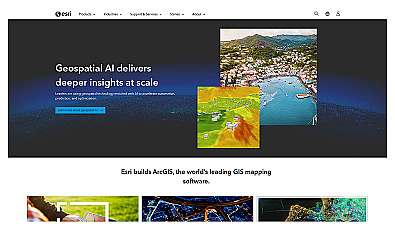
Spatial data visualization and analysis for informed decision-making.
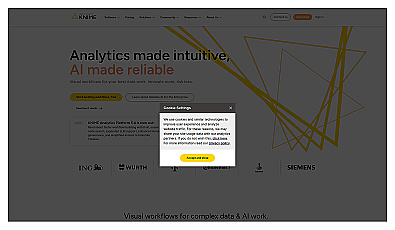
Visual data analytics and workflow automation for all users.
A framework for scientific computing and machine learning.
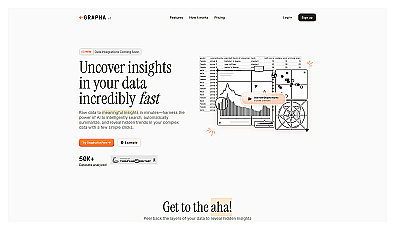
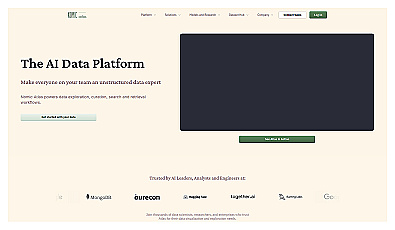
AI-powered data exploration and visualization platform.
User-friendly data analytics for quick insights and collaboration.
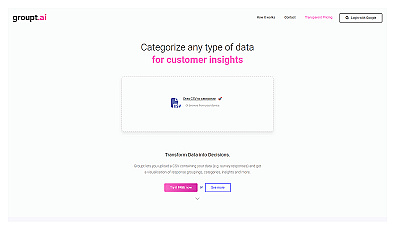
Streamlined data categorization and visualization for insightful analysis.