Visual Representation Creation Tools
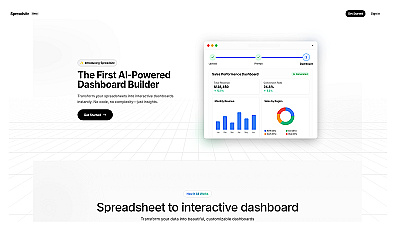
Transform spreadsheets into interactive dashboards effortlessly.
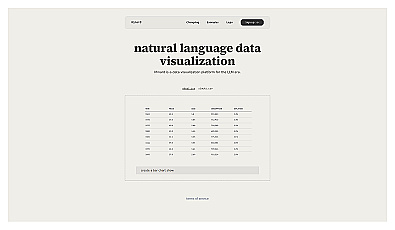
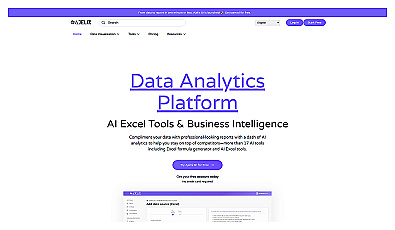
Visualize data effortlessly with natural language insights.
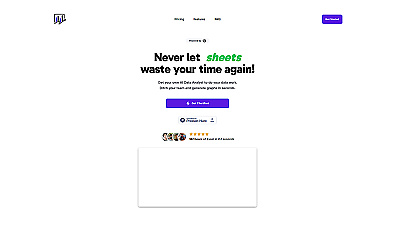
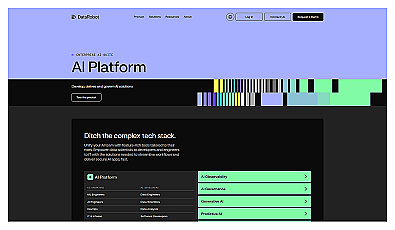
AI-powered data analysis and visualization tool.
Streamlines data visualization and reporting in Google Sheets.
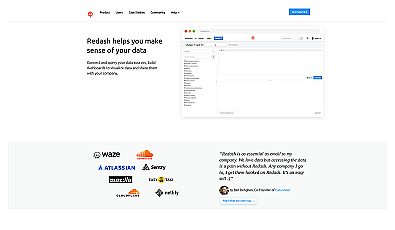
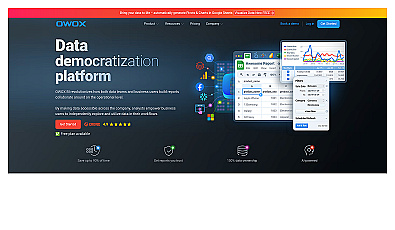
Visualize and share data insights with ease.
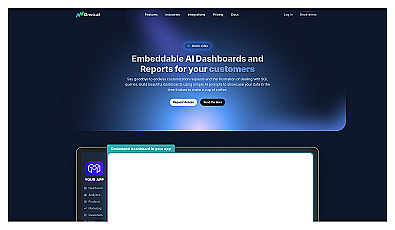
Create dashboards and reports effortlessly with AI prompts.

Build interactive web applications from Python scripts effortlessly.
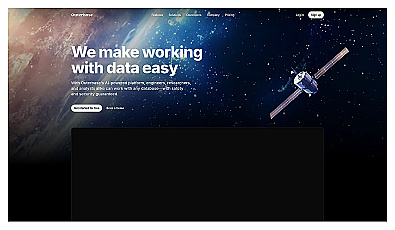
A user-friendly interface for querying databases seamlessly.
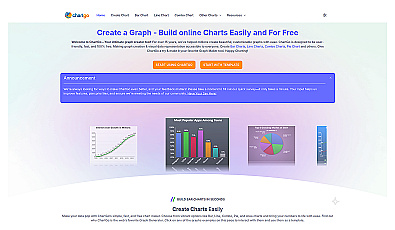
Create various customizable charts for visual data representation.
A comprehensive framework for predictive modeling in R.
AI-driven spreadsheet enhancement for automated data analysis.
Connects multiple data sources to spreadsheets effortlessly.
Smart assistant for effortless spreadsheet management using AI.
Visualize and report on key business metrics in real-time.
Automated machine learning for data-driven decision-making.
Generate insightful reports and visuals in moments with AI support.
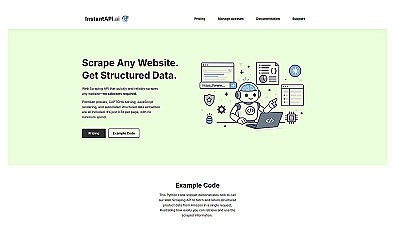
Effortlessly scrape structured data from any website.
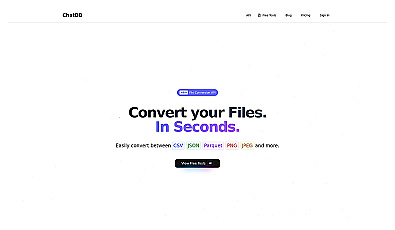
Quickly convert and edit various data formats online.

Advanced data analysis and automation for informed decision-making.
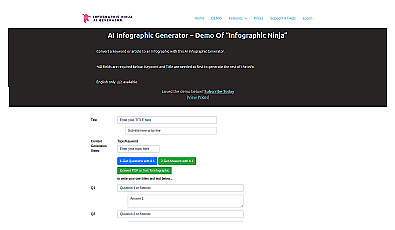
Design captivating infographics to visualize complex information clearly.
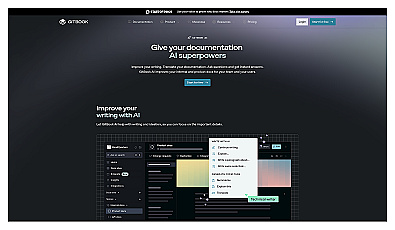
Collaborative documentation for teams with AI writing assistance.
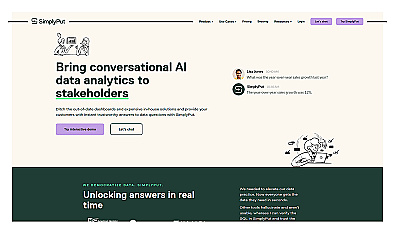
Ask questions about data and get instant, clear answers.
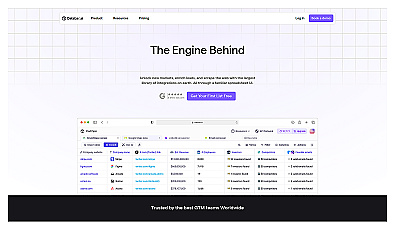
Automated data collection and enrichment for informed decision-making.