Data Visualization For Projects Tools
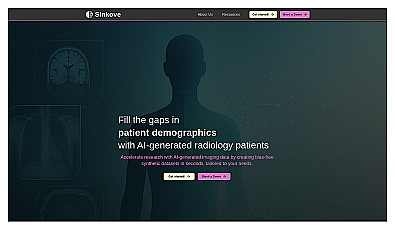
AI-generated imaging datasets for disease research and treatment development.
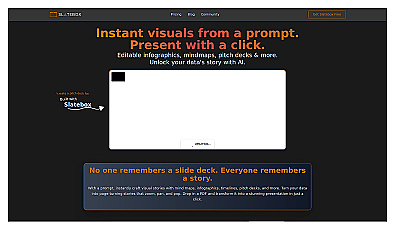
Create engaging visuals from data for presentations.
Visualize knowledge and relationships through dynamic graphs.
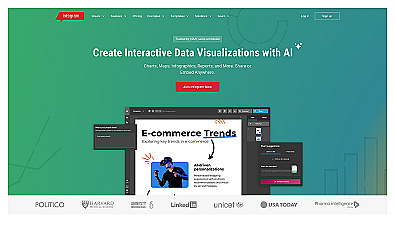
Create engaging interactive data visualizations effortlessly.
Capture detailed 3D models using your smartphone effortlessly.
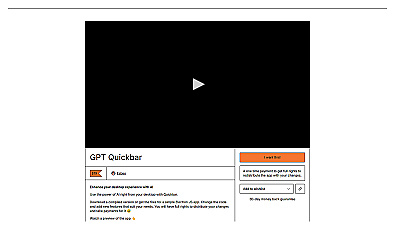
Integrate AI functionality directly into your desktop experience.

Create interactive web applications for data visualization.
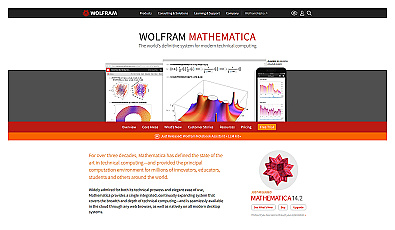
Advanced environment for mathematical computing and data visualization.
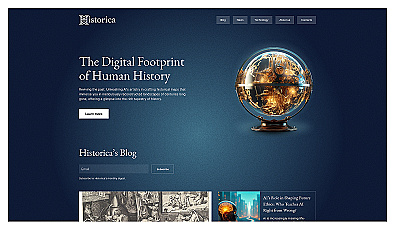
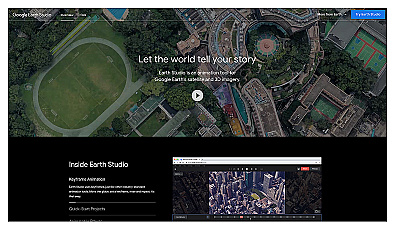
Explore history through detailed, interactive maps.
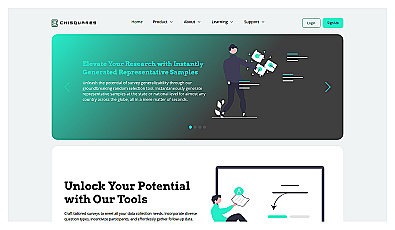
Generate quick, representative survey samples for research projects.
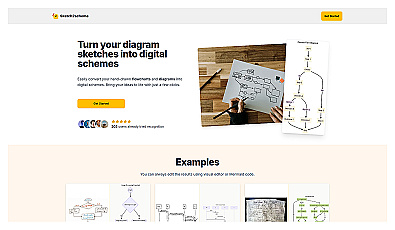
Transform sketches into polished digital diagrams effortlessly.
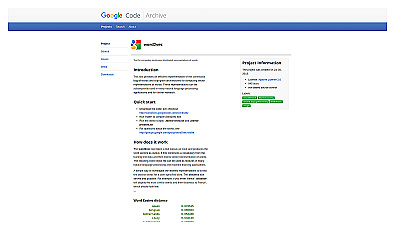
Library for scientific computing with algorithms in Python.
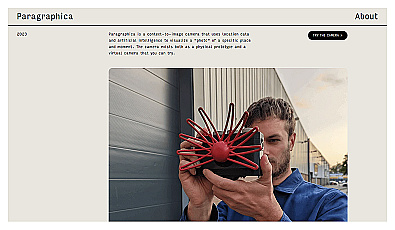
AI-generated visuals that creatively interpret your surroundings.
User-friendly interface for designing advanced diffusion models.
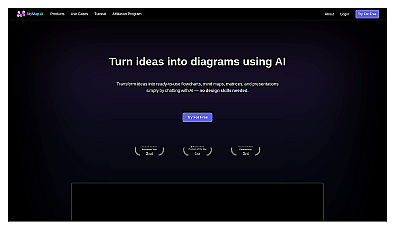
Visualize ideas and concepts effortlessly with intelligent diagrams.
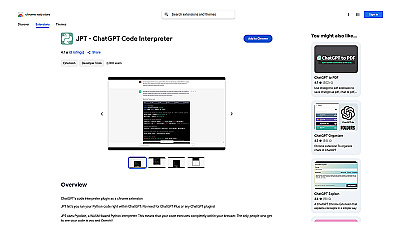
Instantly run Python code directly in your browser.
Create and monetize customized AI language models for various needs.
Legal risk assessment and client connection for attorneys.
Search and summarize academic research with real-time updates.
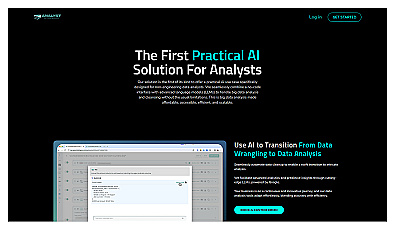
Powerful analytics for non-engineers to streamline data insights.
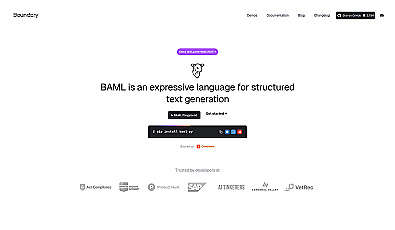
Streamlined structured data generation for developers and LLMs.
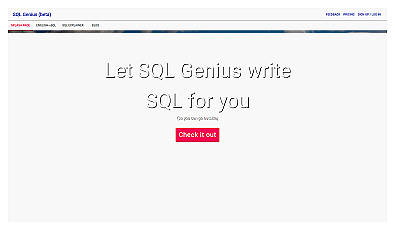
Generate SQL queries effortlessly with plain English input.
AI-driven video analytics for understanding human behavior.