WhyHive

WhyHive

Simplifies data analysis with visual insights and text interpretation.

Visit Website
WhyHive screenshot

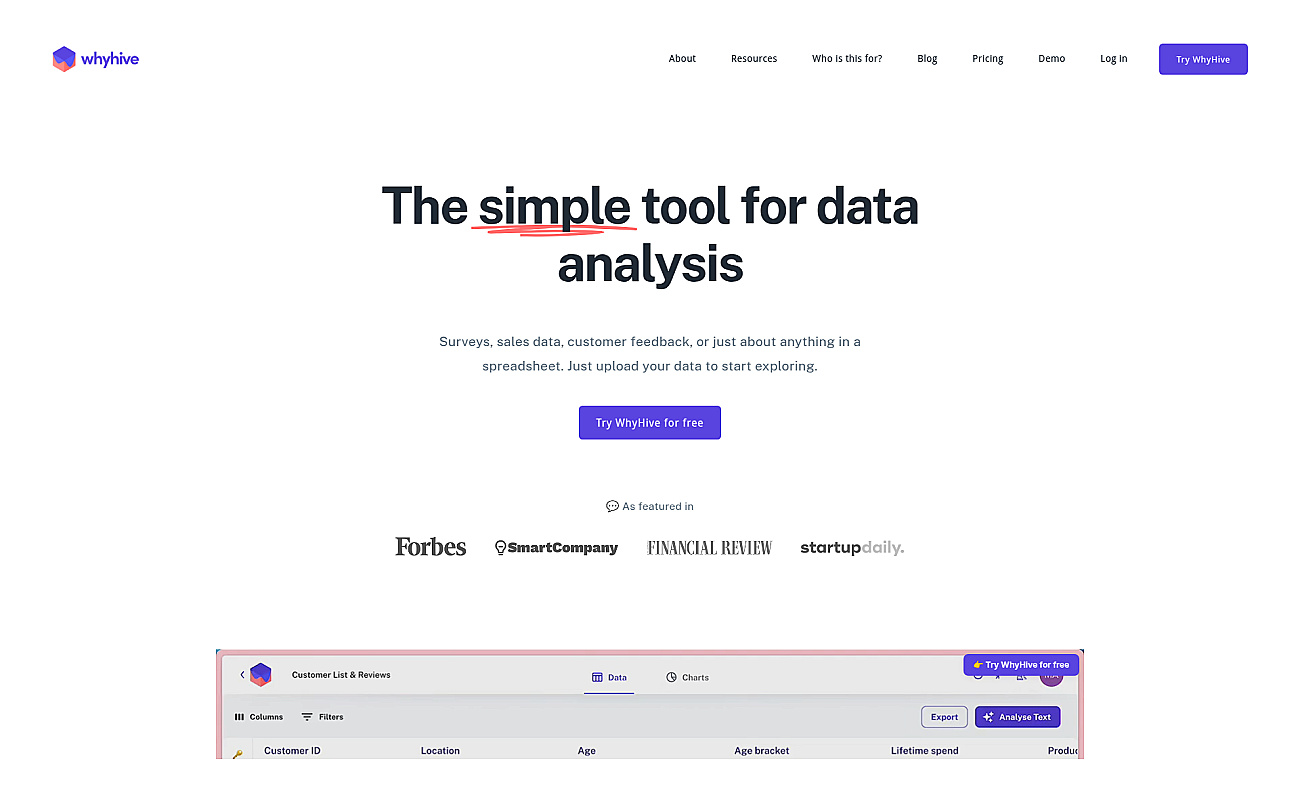
WhyHive is designed for anyone needing to analyze data, whether it’s from surveys or sales figures. This resource allows easy data uploads, making analysis accessible without special skills.

Users create visuals and charts quickly, transforming raw information into understandable insights. It effectively summarizes text responses, providing valuable themes and trends. Researchers and marketers find this especially useful for presenting data to stakeholders.

WhyHive promotes efficient decision-making and supports various needs, from evaluating impact to enhancing marketing strategies. By streamlining the process, it ensures that anyone can engage with their data confidently.


  • Analyze survey results efficiently
  • Generate insights from customer feedback
  • Create visual presentations quickly
  • Summarize sales data trends easily
  • Transform text data into actionable themes
  • Streamline impact evaluation processes
  • Facilitate team decision-making with data
  • Support startup pitches with clear data
  • Enhance marketing campaign analysis
  • Automate coding of open-ended responses
  • User-friendly interface for easy data analysis
  • Quickly generates visual insights and charts
  • Supports both qualitative and quantitative analysis
  • Safe and private data storage options
  • No prior training needed to use effectively


Looking for alternatives?

Discover similar tools and compare features

View Alternatives

Product info