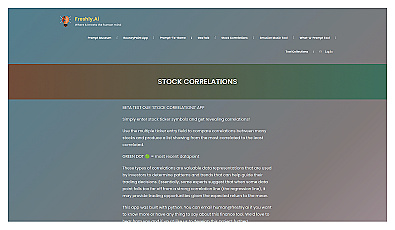
Freshly.ai
Discover stock relationships to enhance trading strategies.
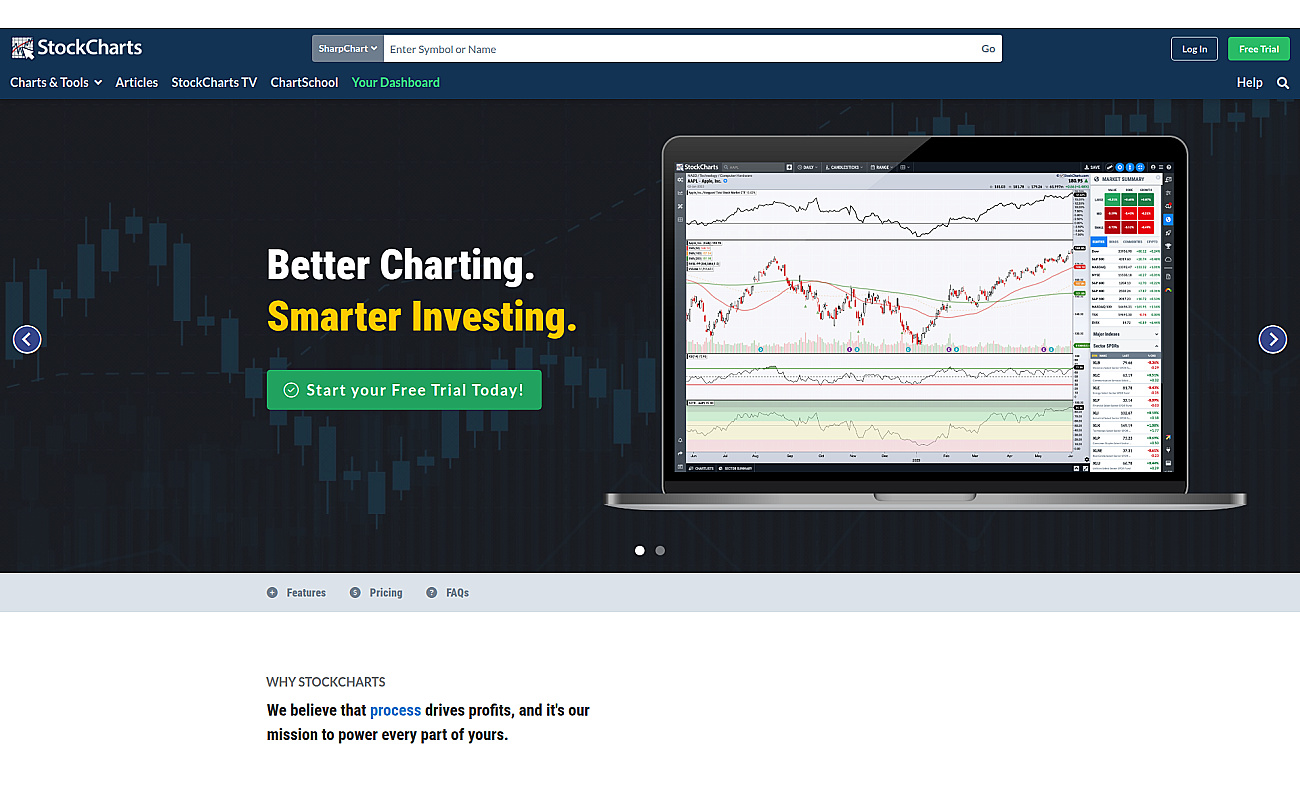
Visualize stock performance and analyze financial data easily.
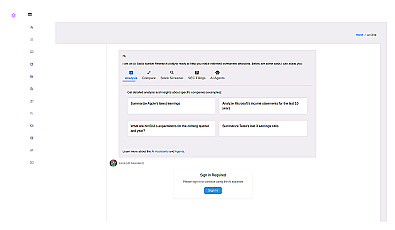
StockCharts provides resources for analyzing financial data and visualizing stock performance. It features various charting options that make it easy to identify market trends.
Users can set custom alerts and scan for stocks, enhancing their investment strategies. Portfolio management is also simplified through its detailed insights.
This service is useful for both novice and experienced traders looking to make informed decisions. Accessing historical price data and tracking market changes in real time adds to its comprehensive nature. StockCharts supports multiple data types and offers a user-friendly interface, ensuring that investors have the tools they need for success.
Based on overlapping tasks and related categories.
Discover stock relationships to enhance trading strategies.

AI-driven insights for informed investment decisions.
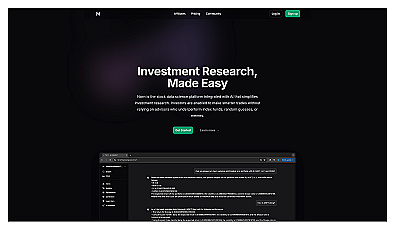
AI-driven insights for smarter stock market decisions.
AI-driven stock market analysis for informed investing decisions.
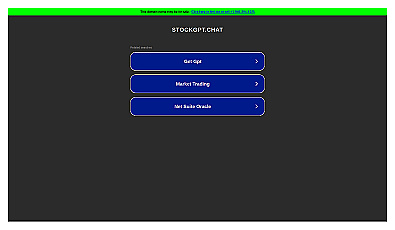
Real-time stock market insights and personalized investment guidance.
Discover other similar tools and compare features